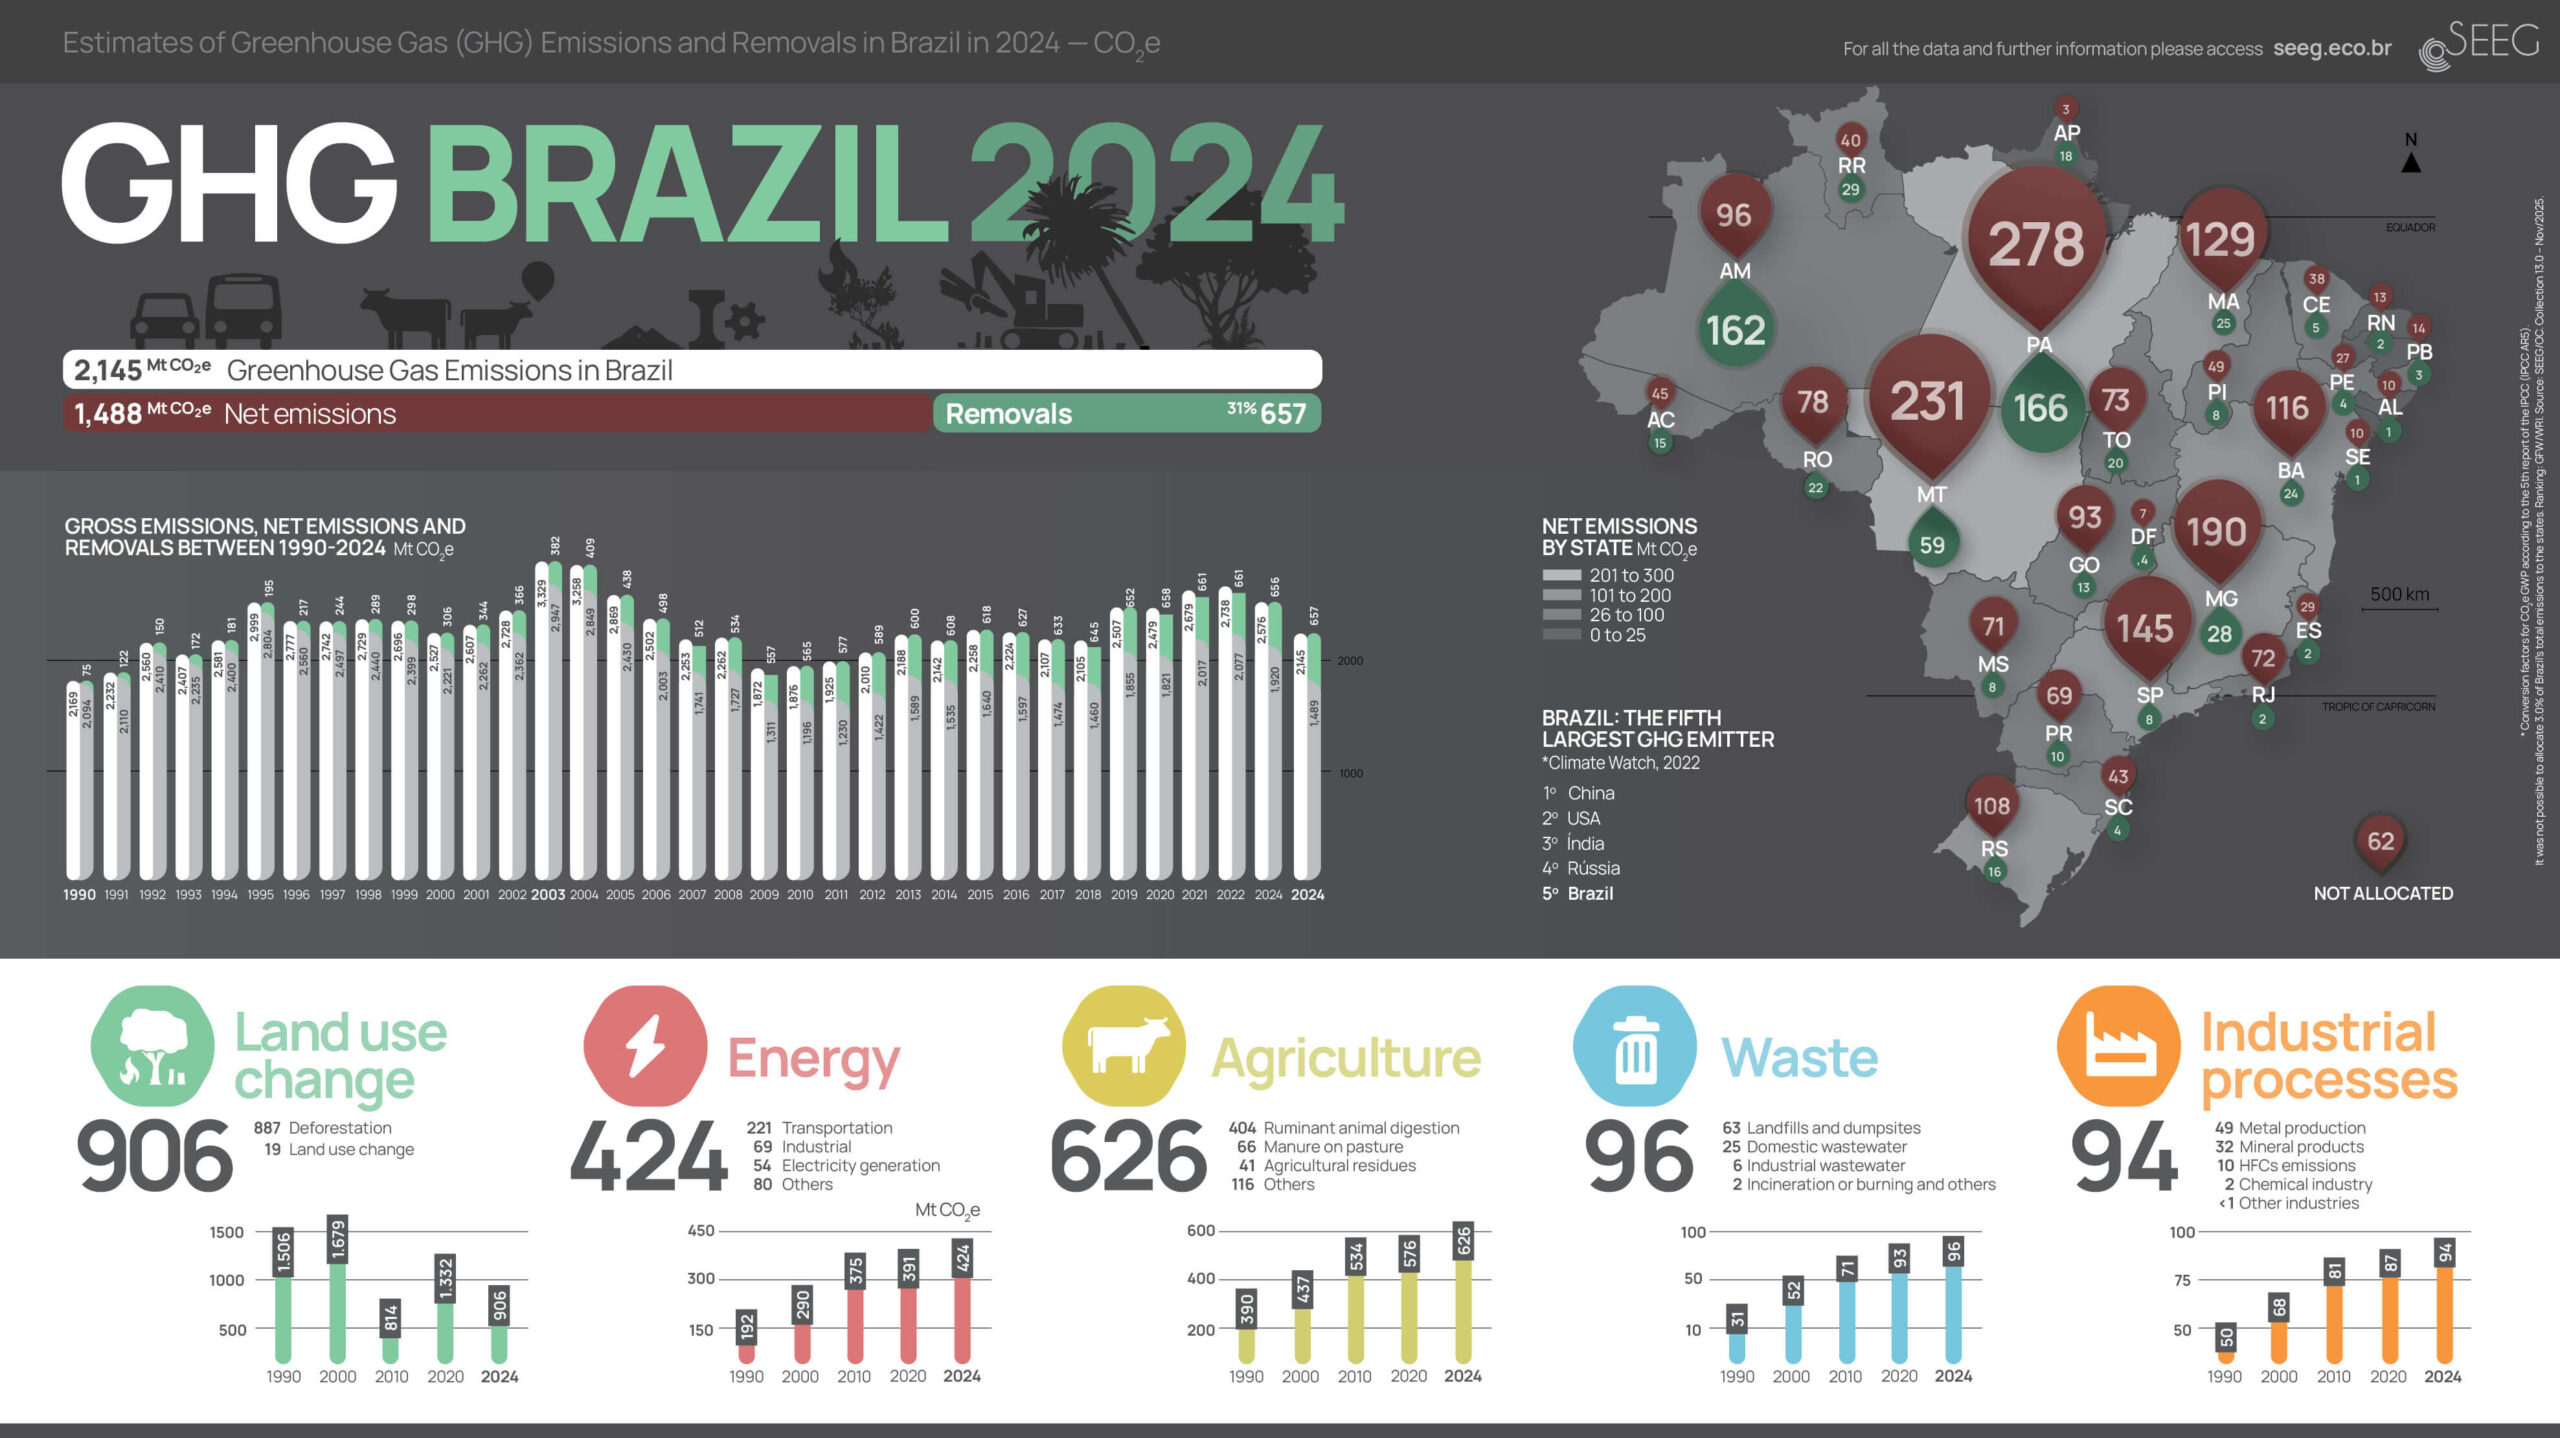
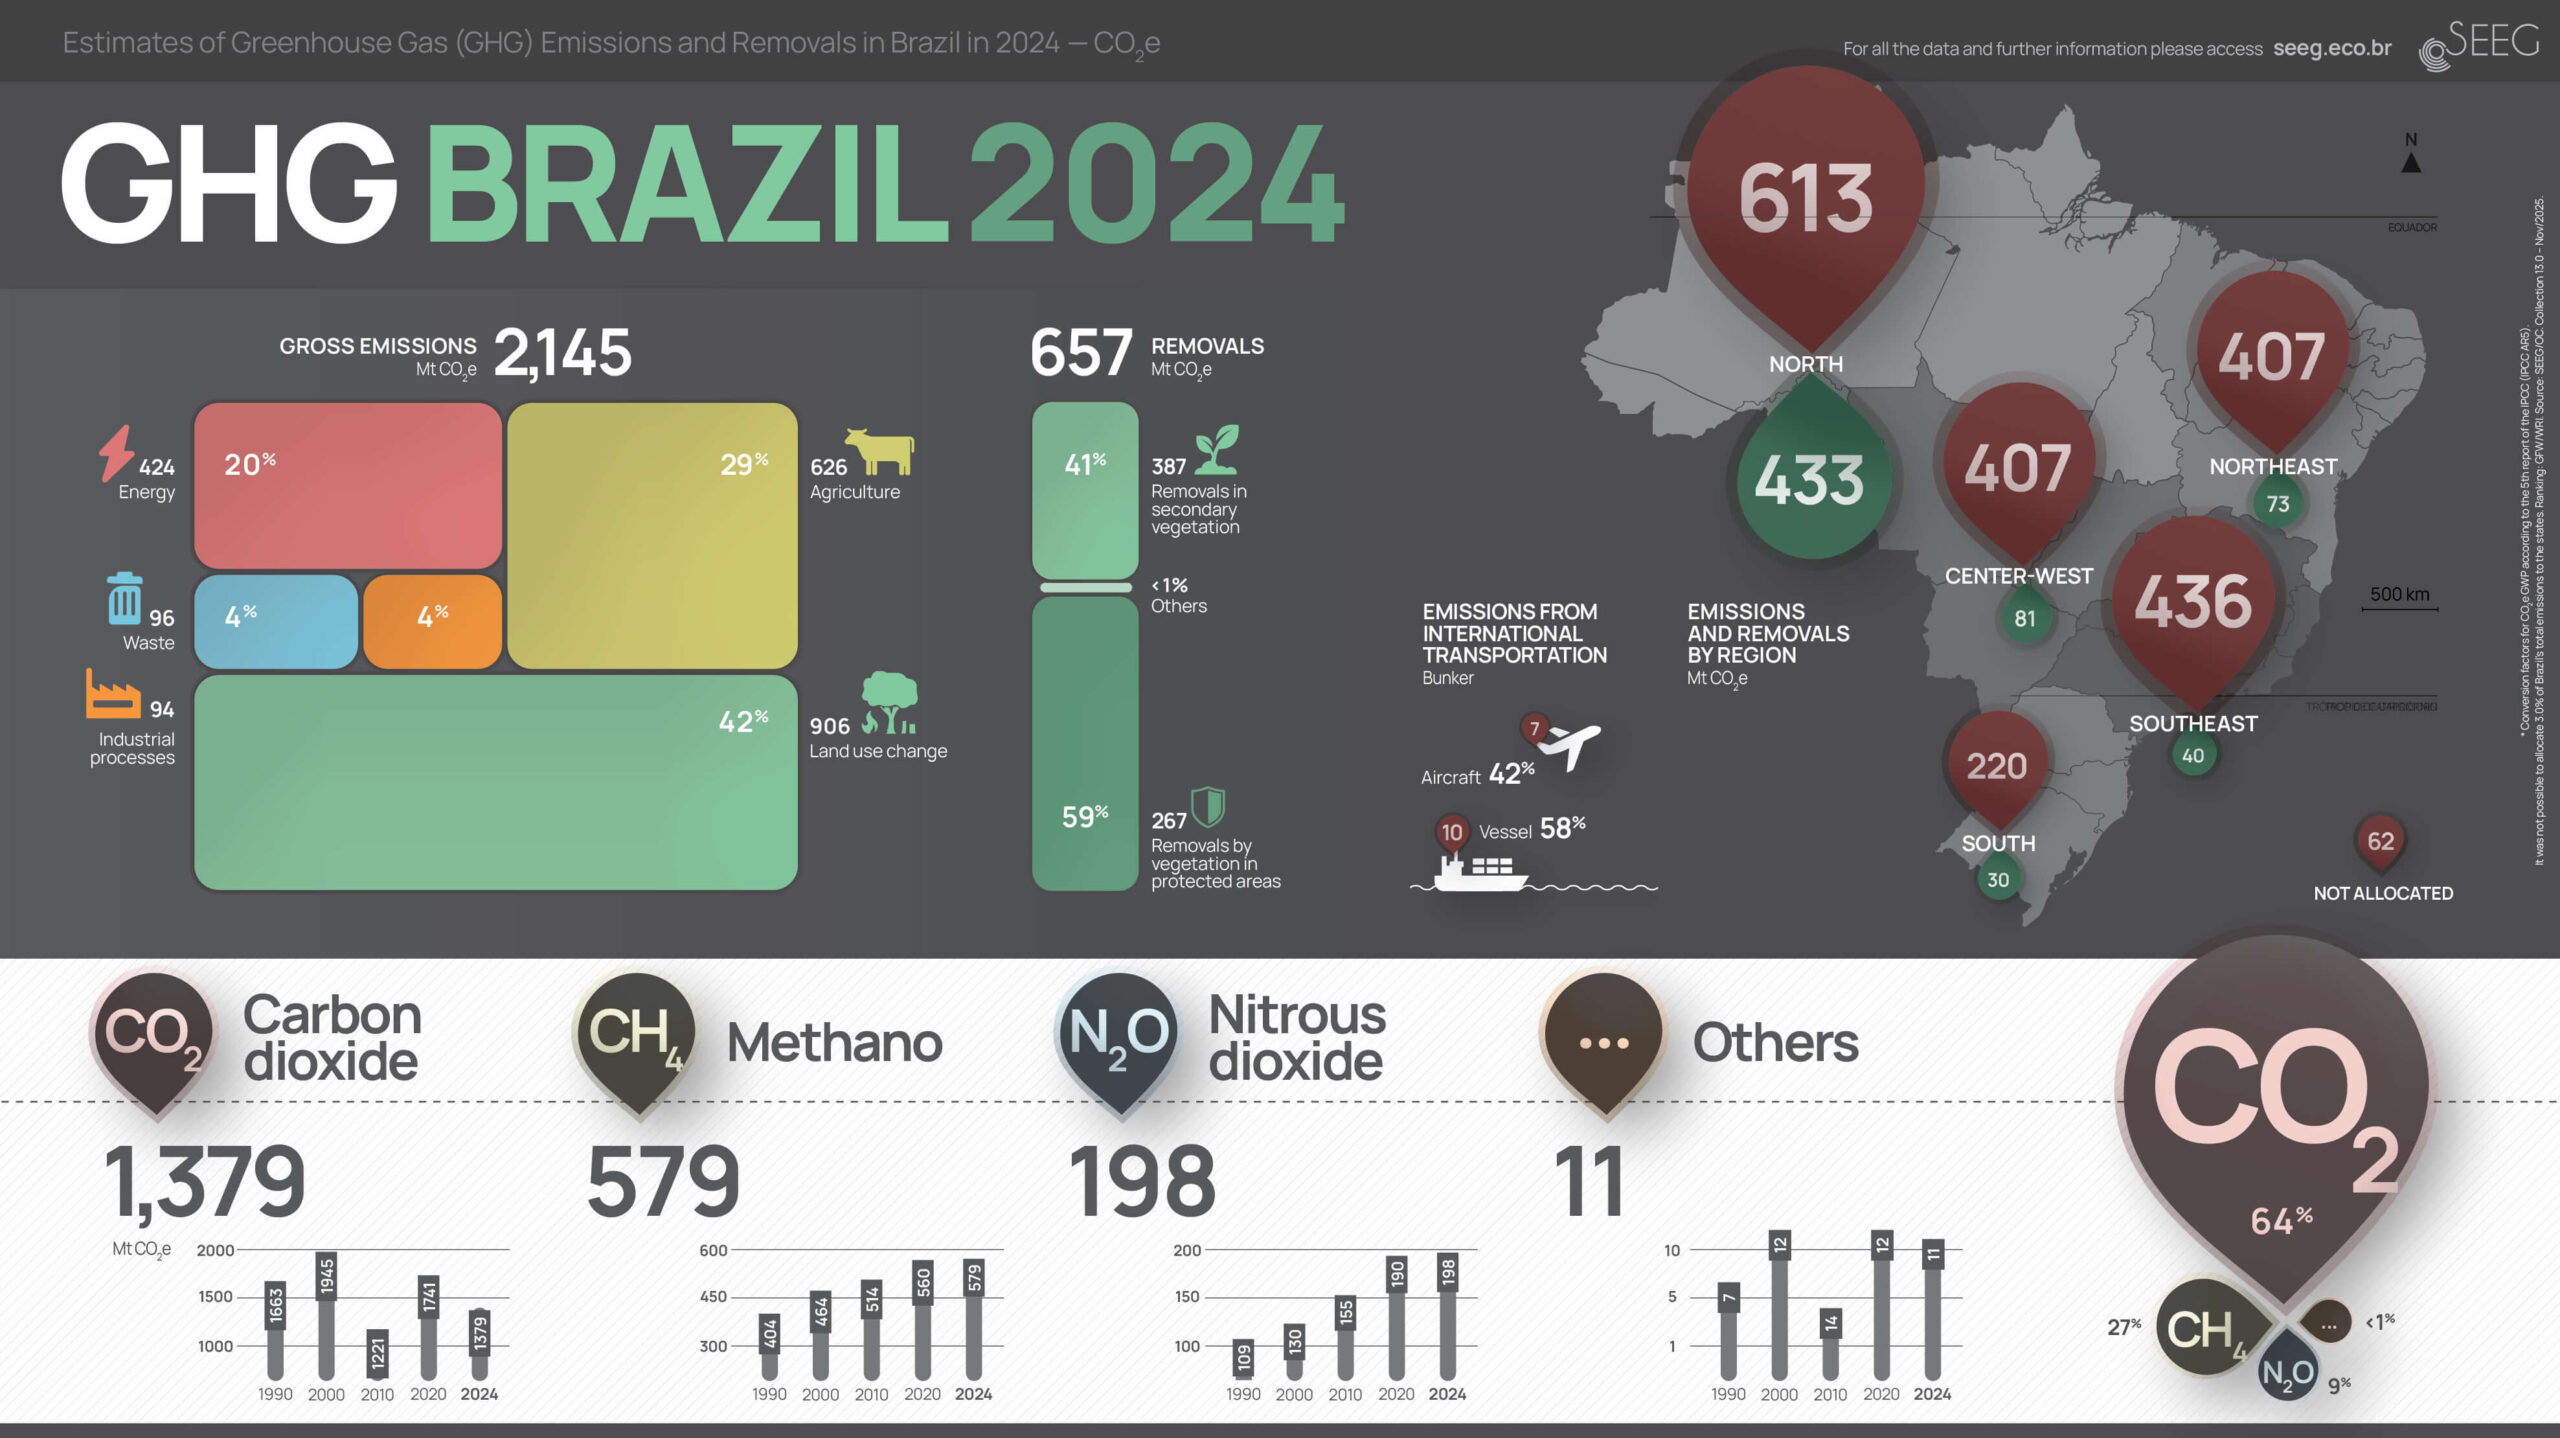
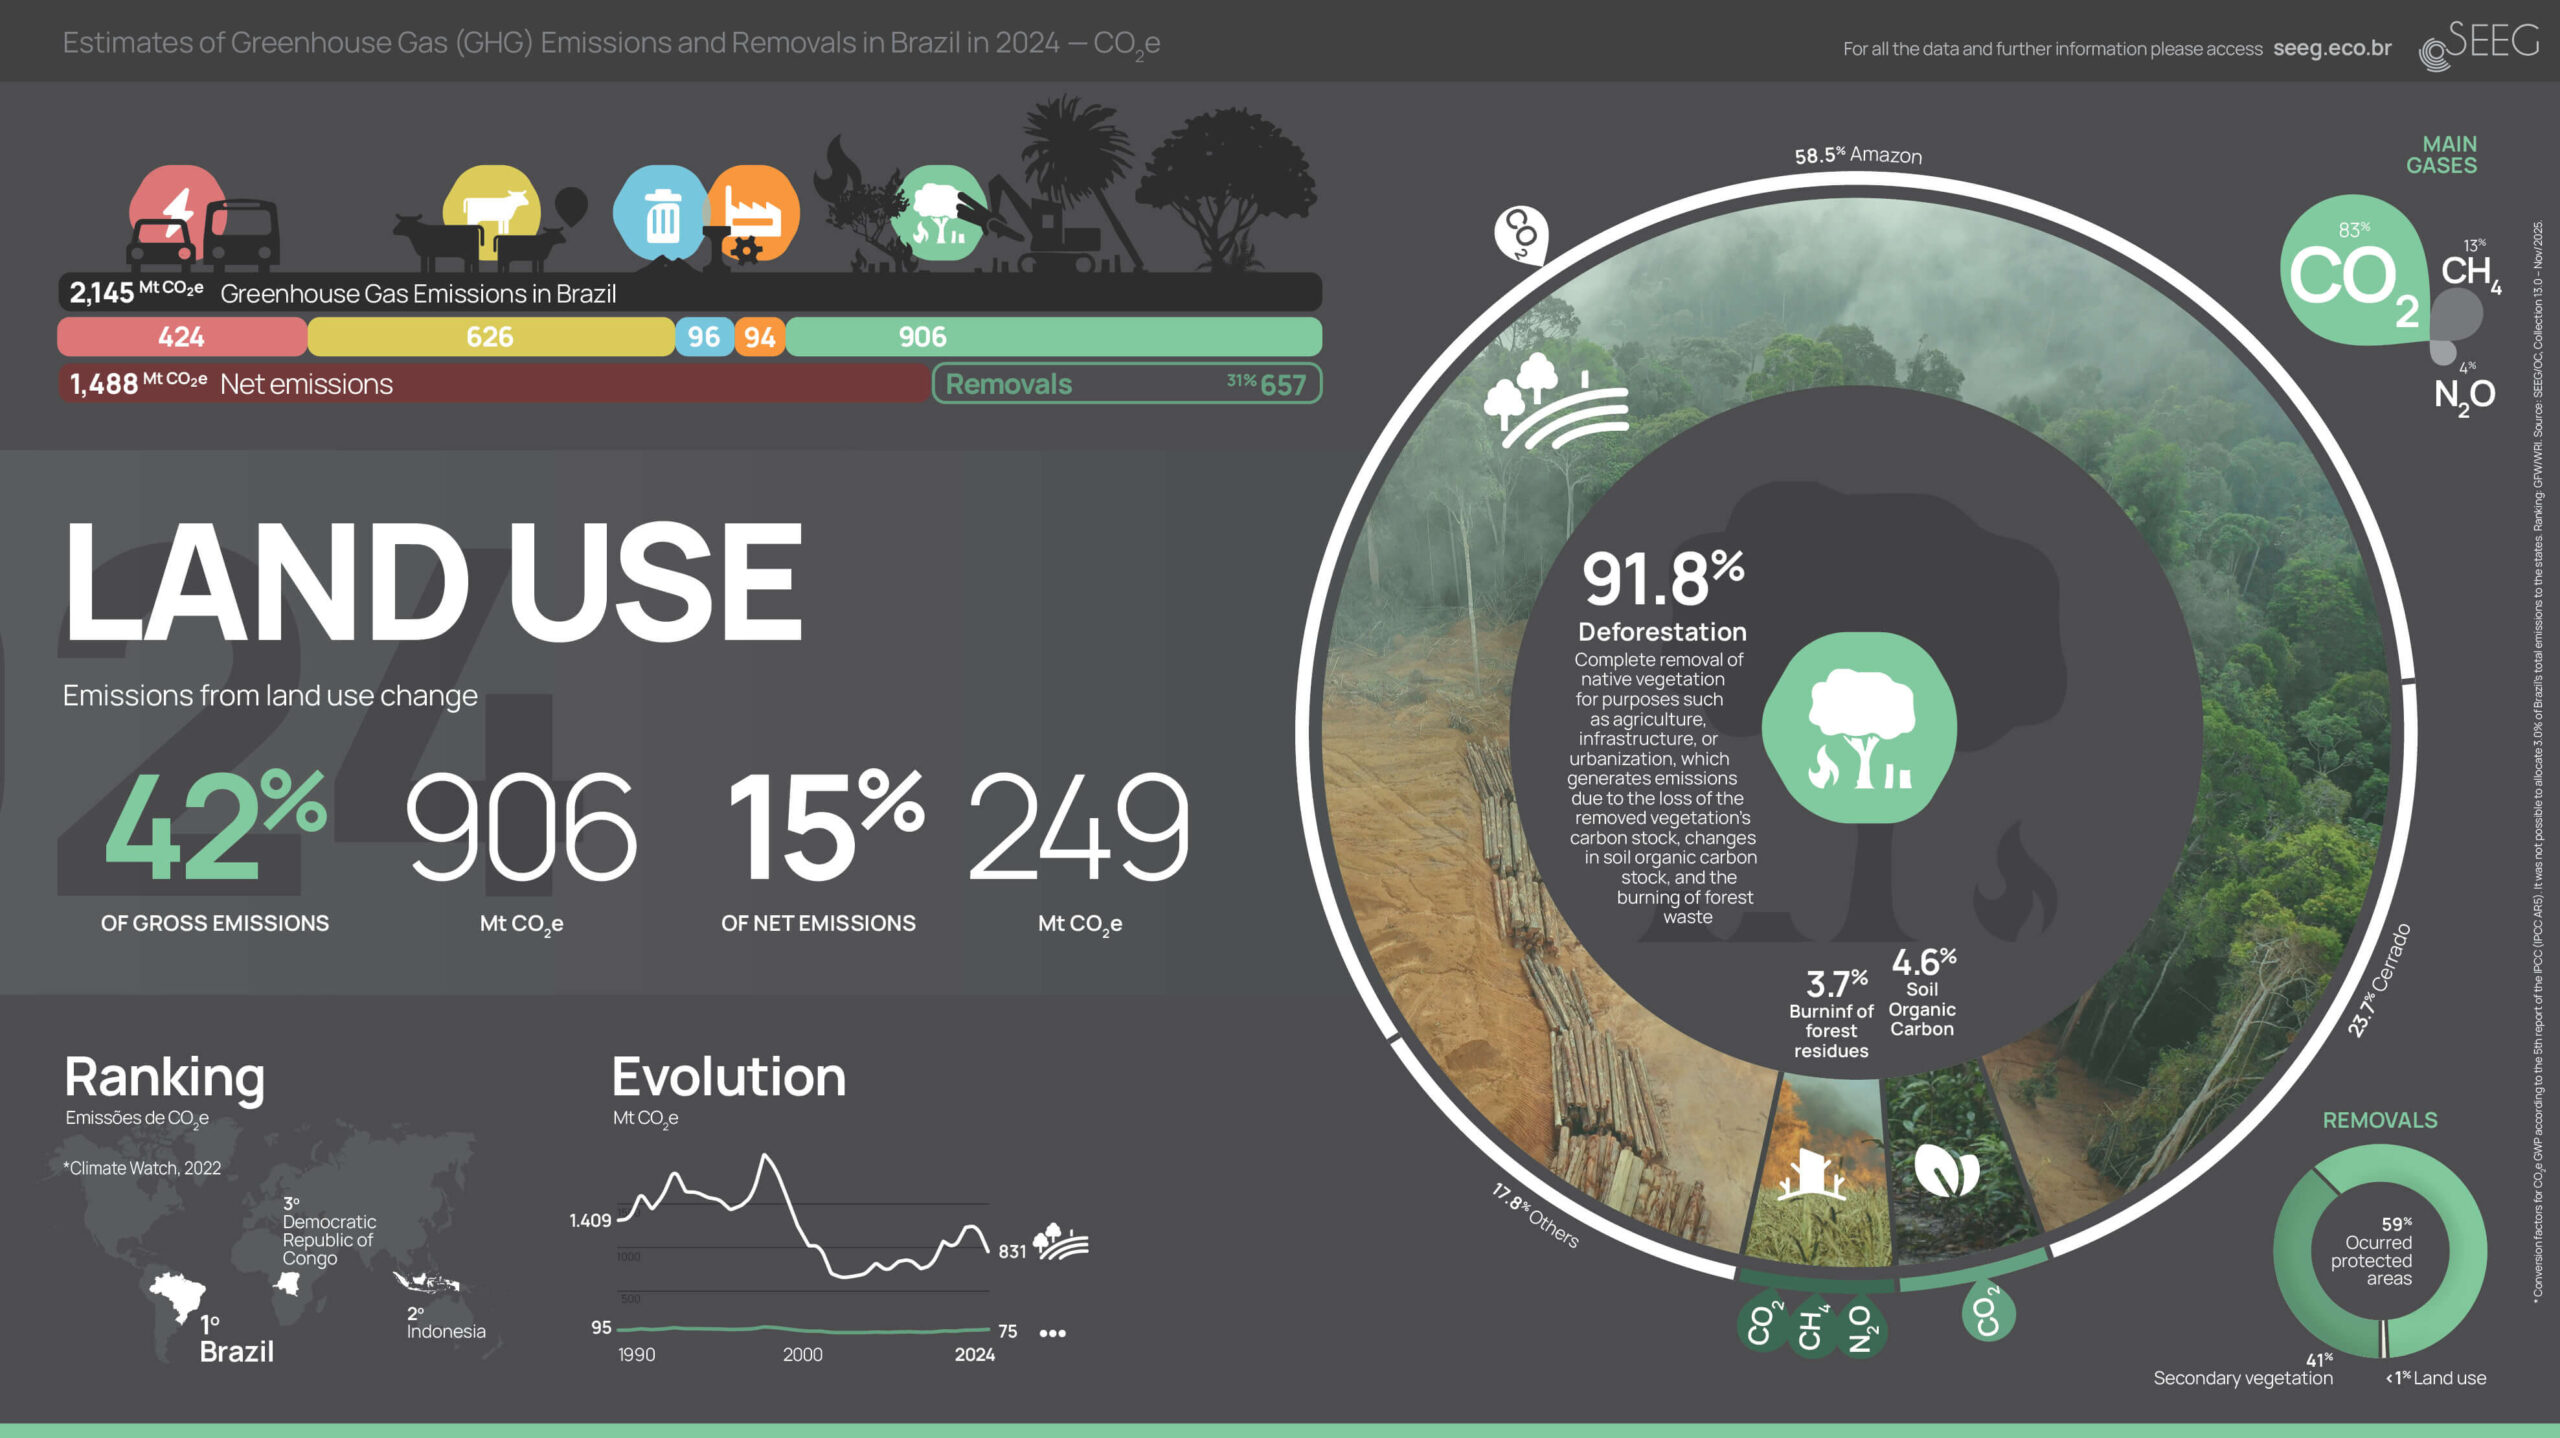
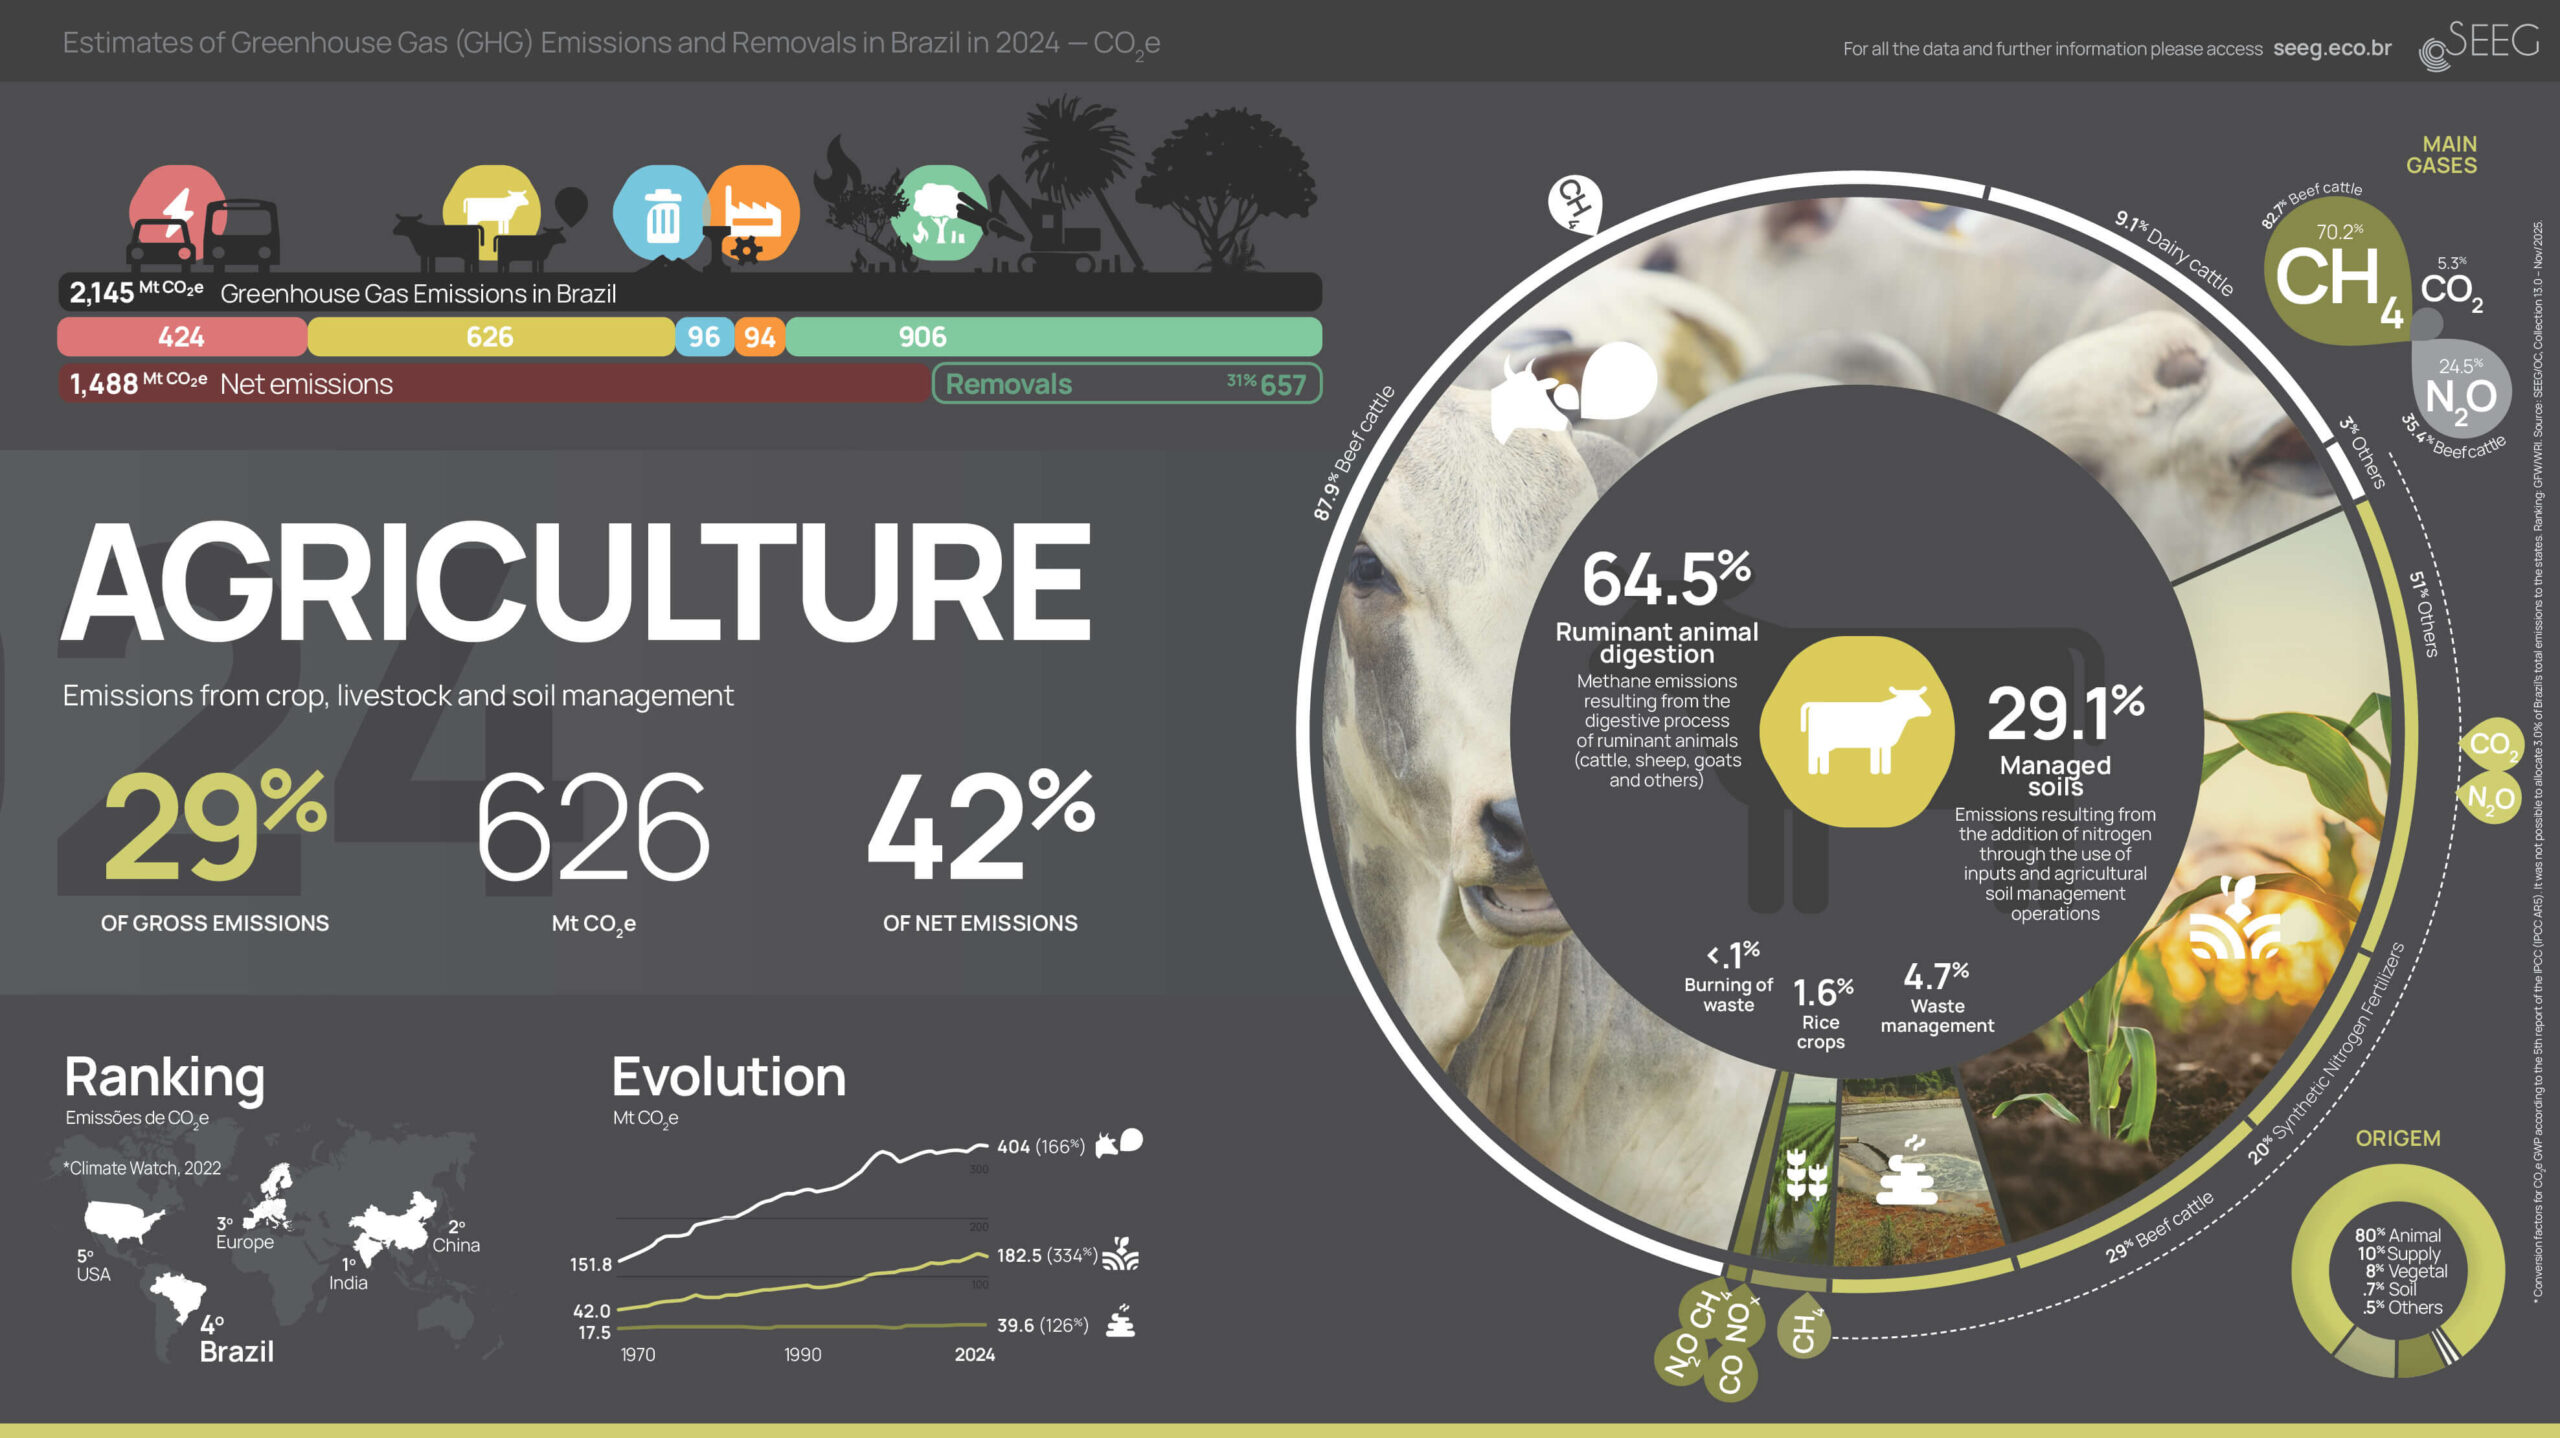
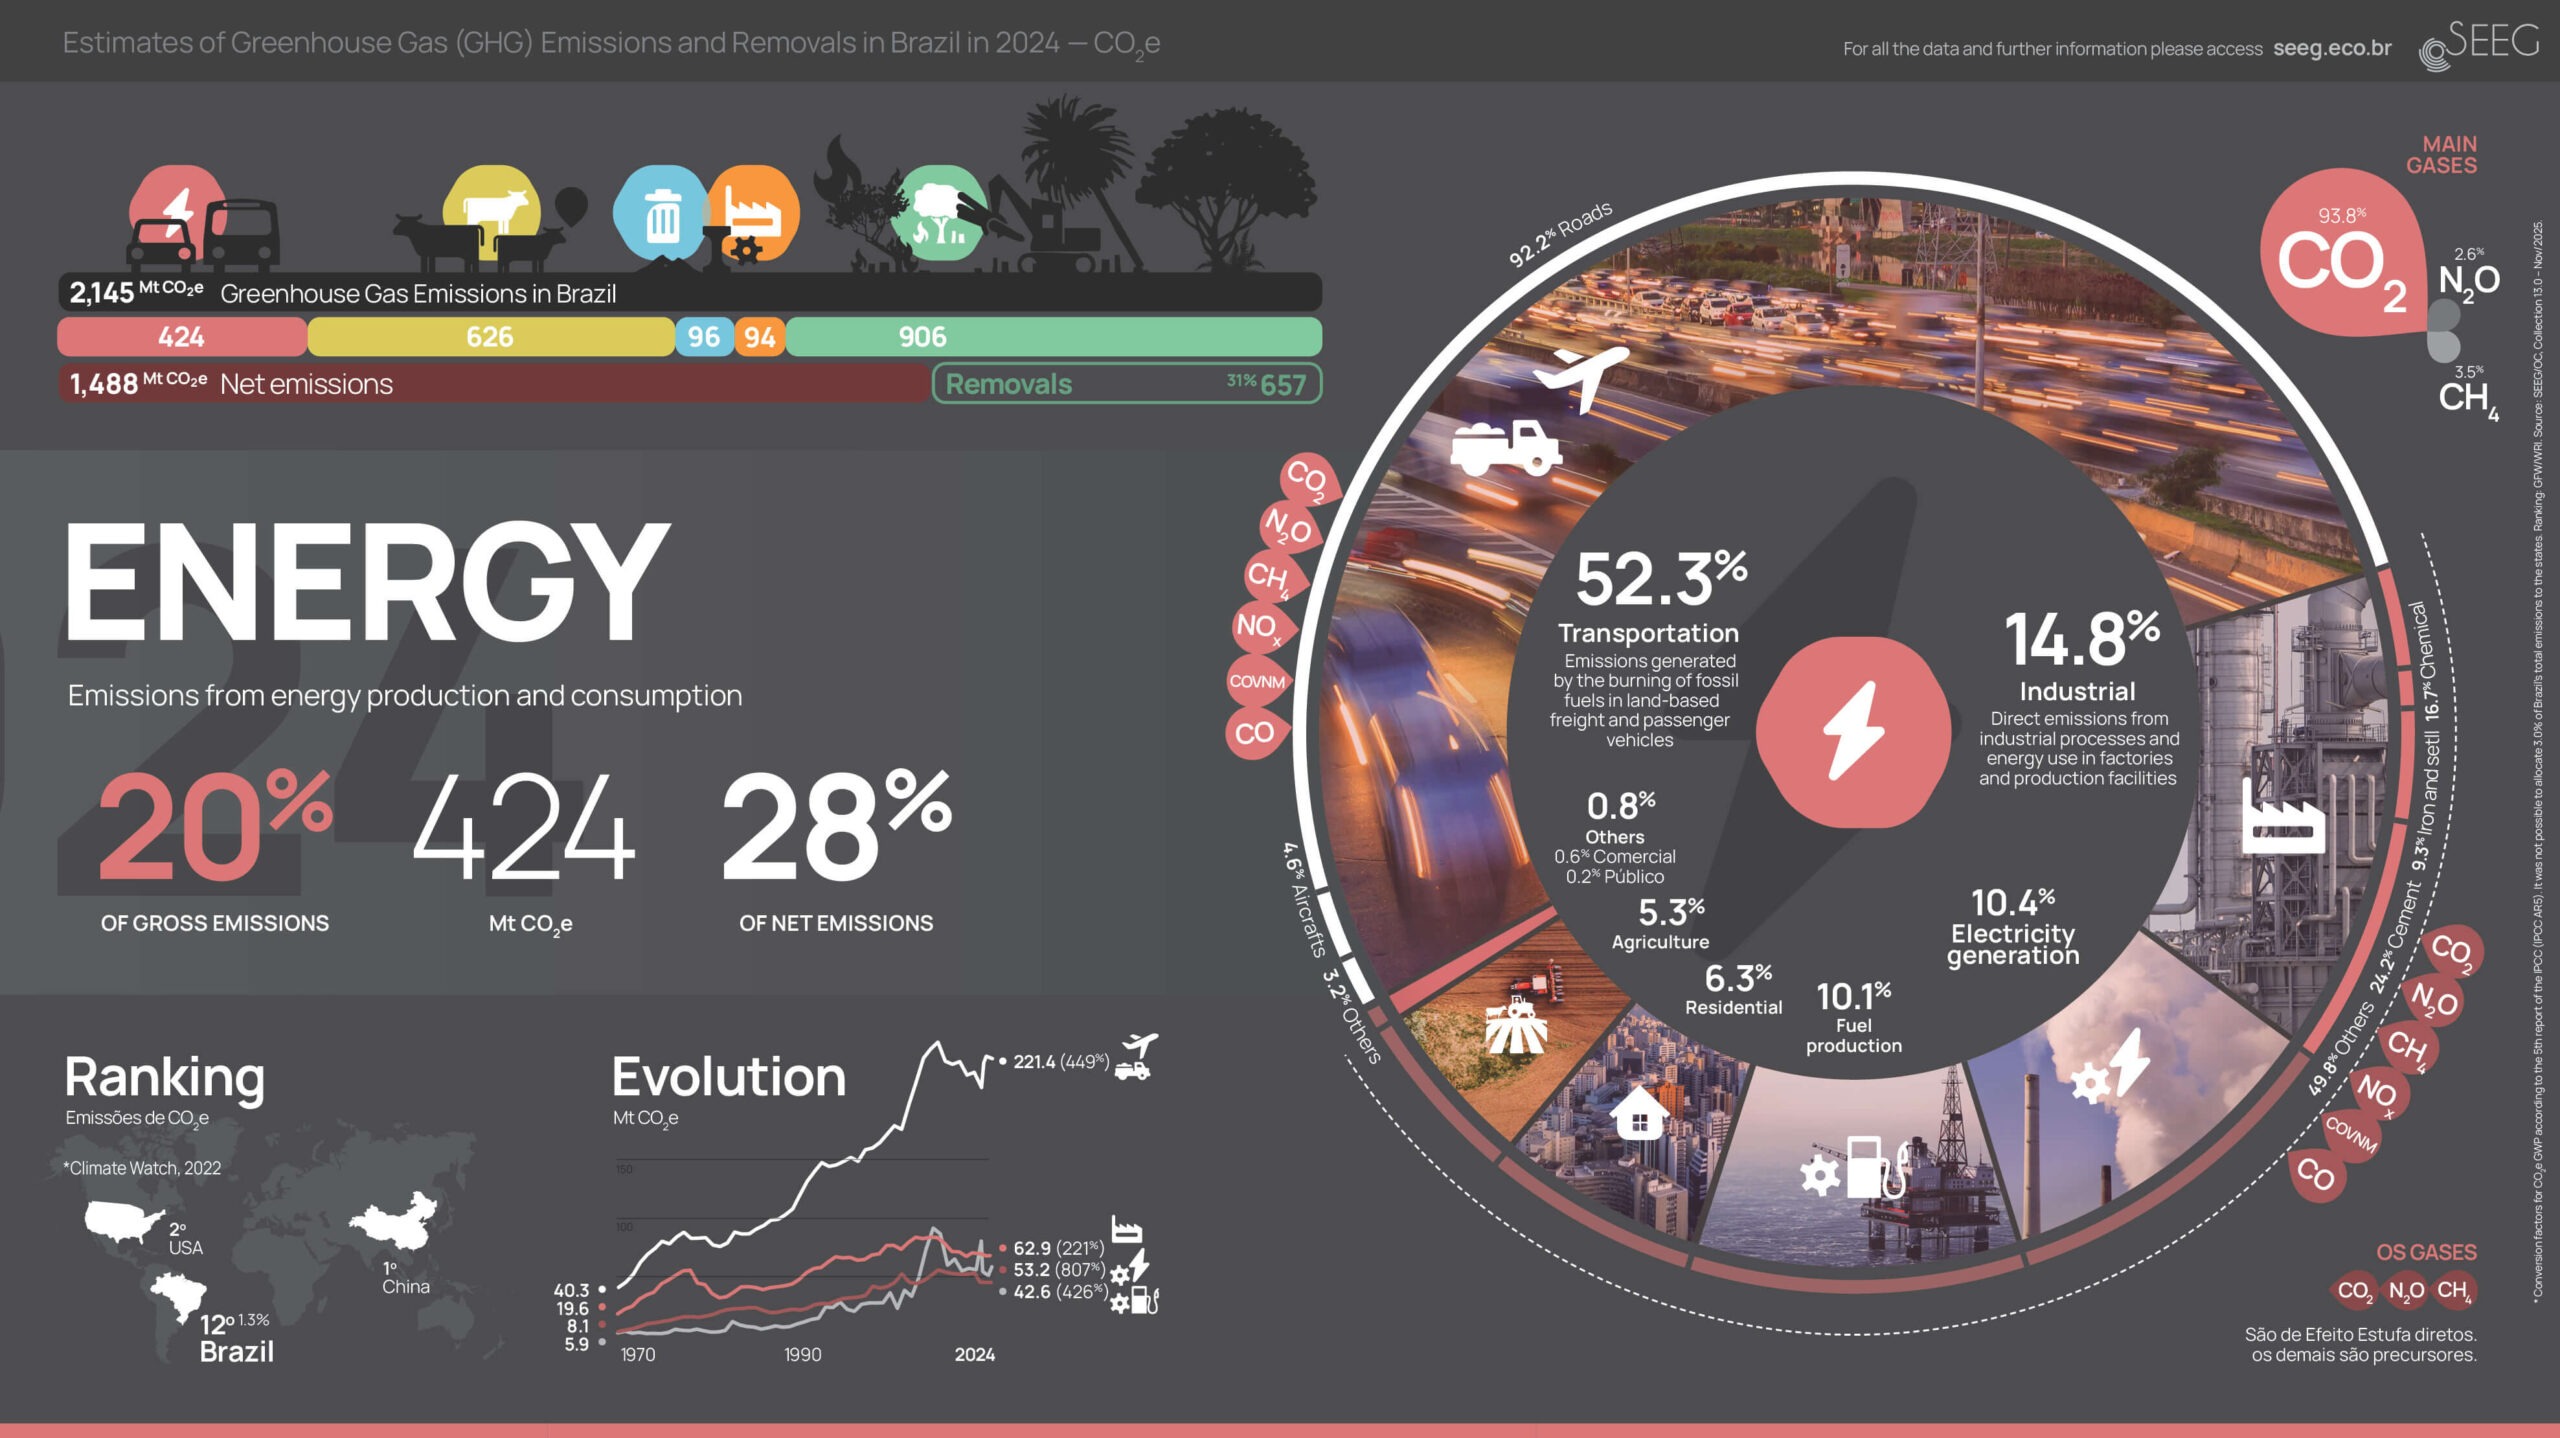
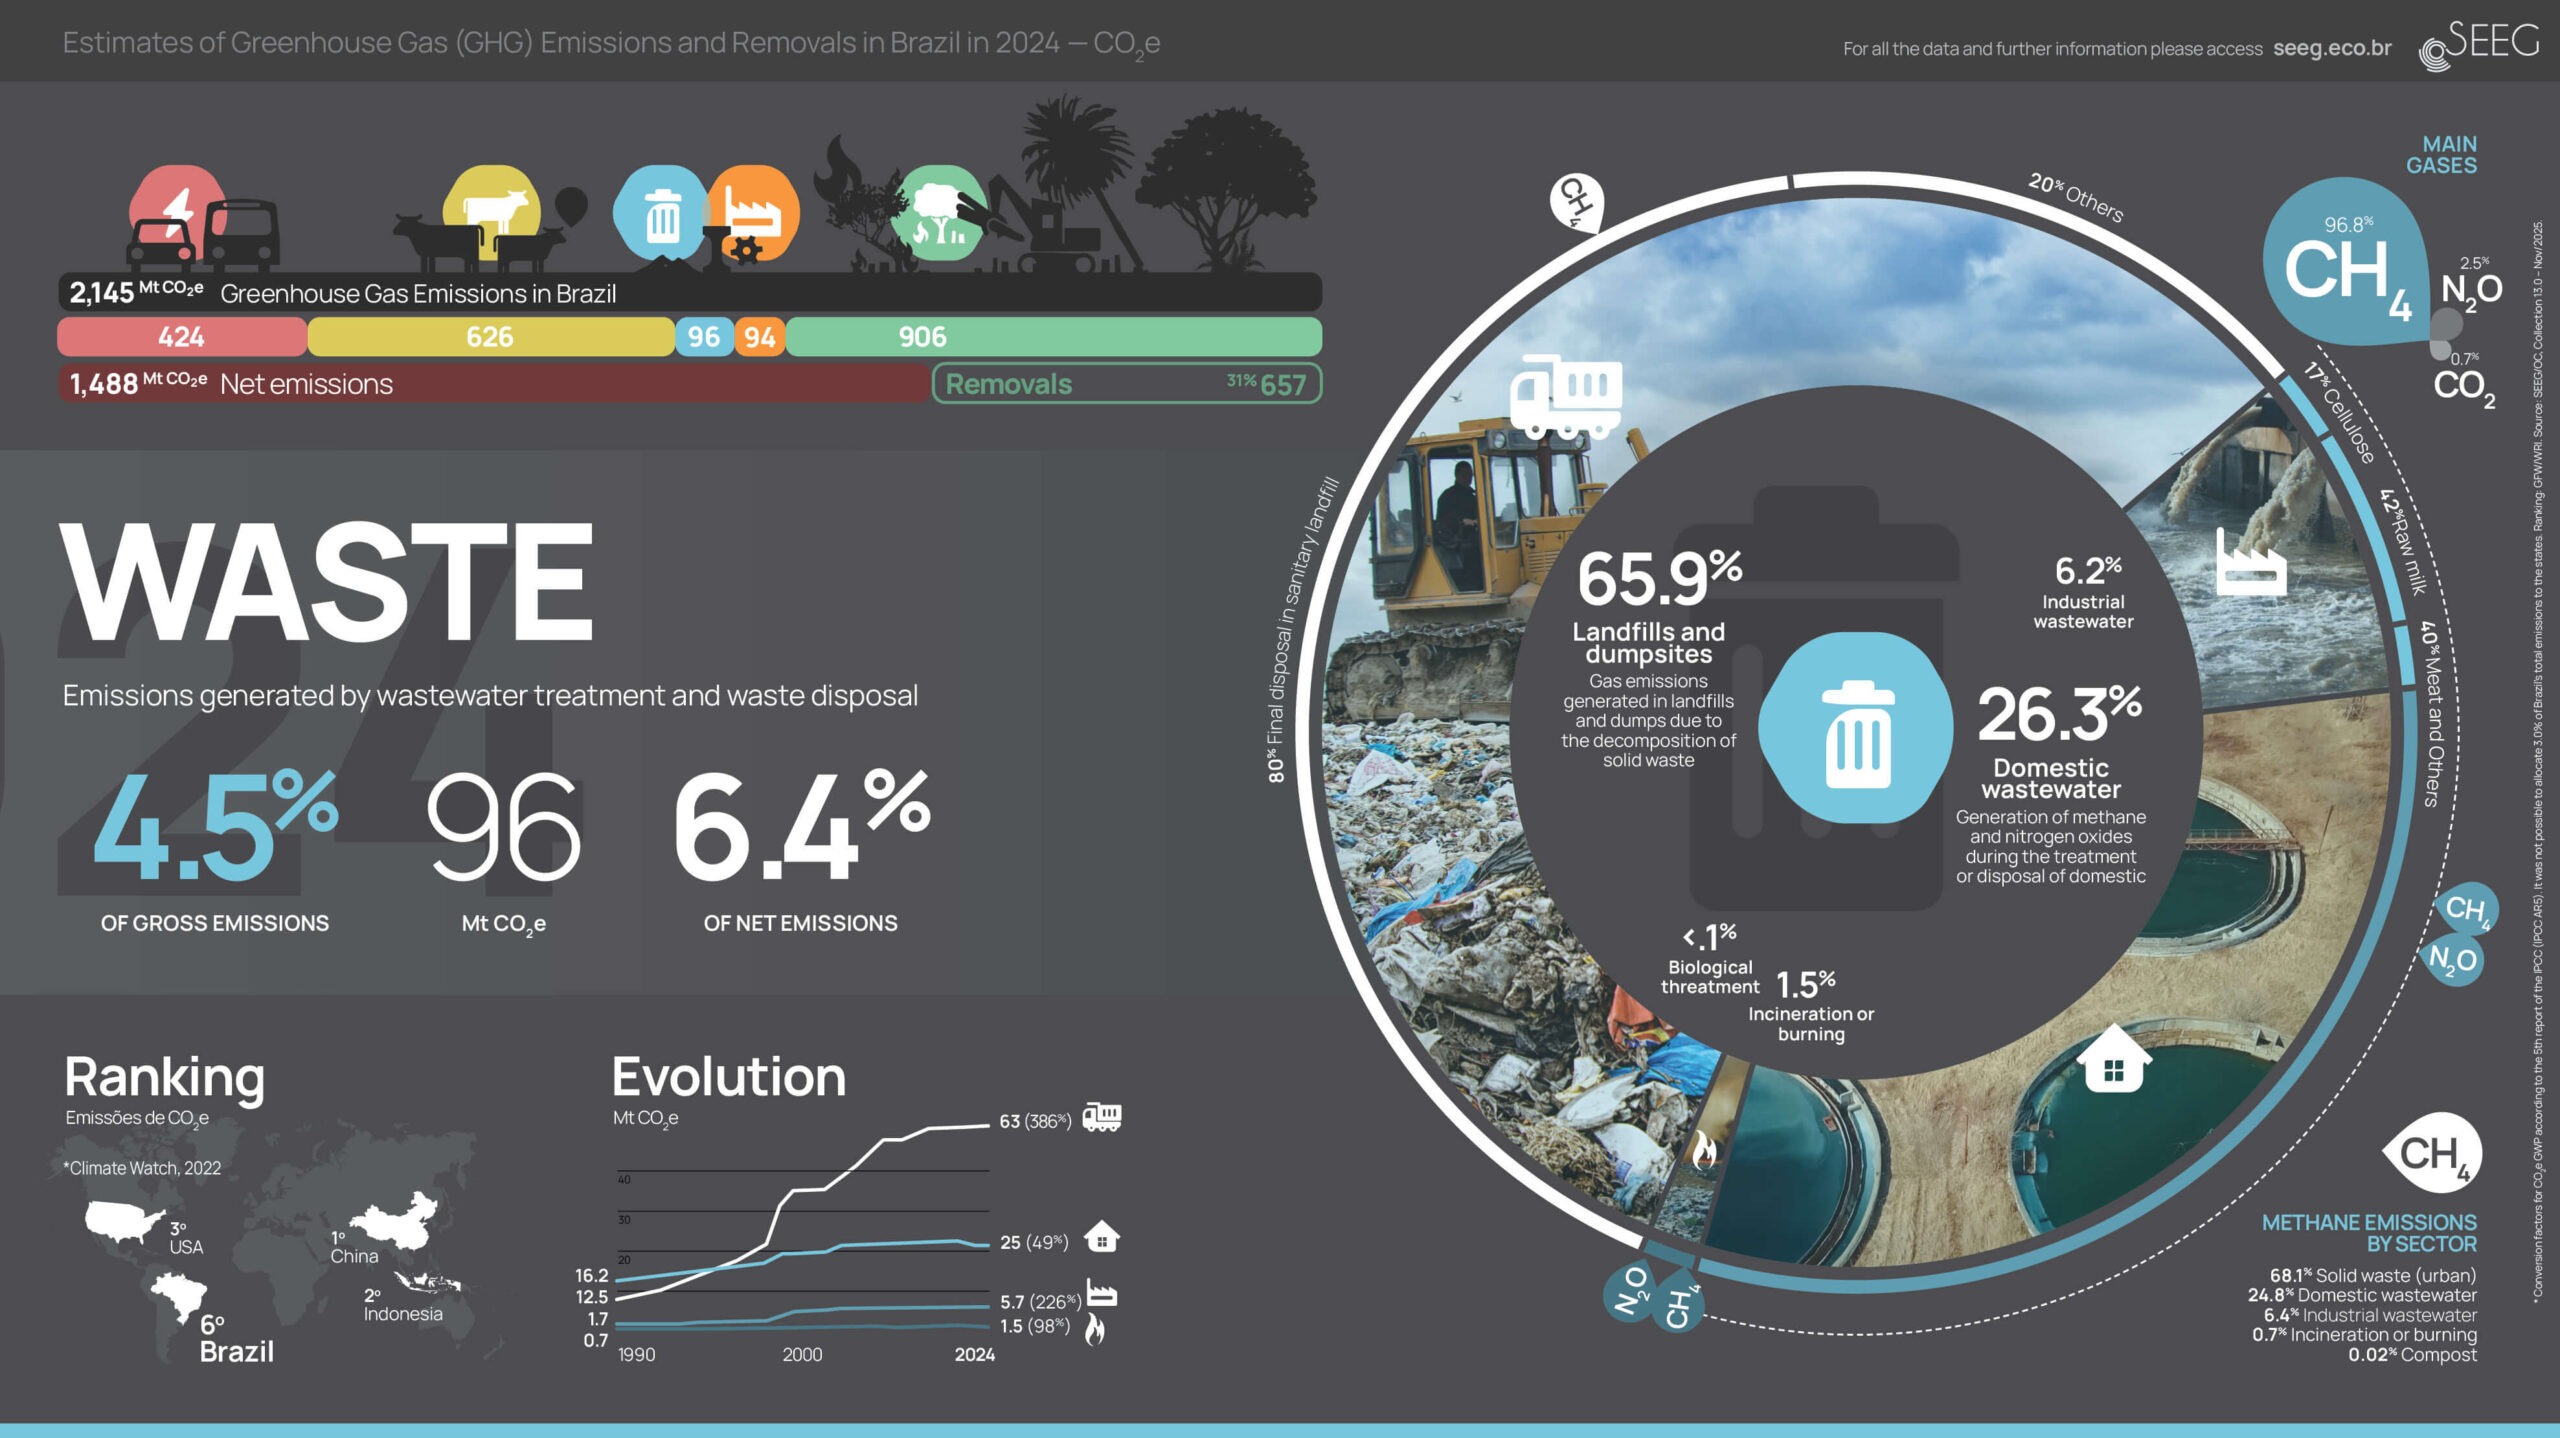
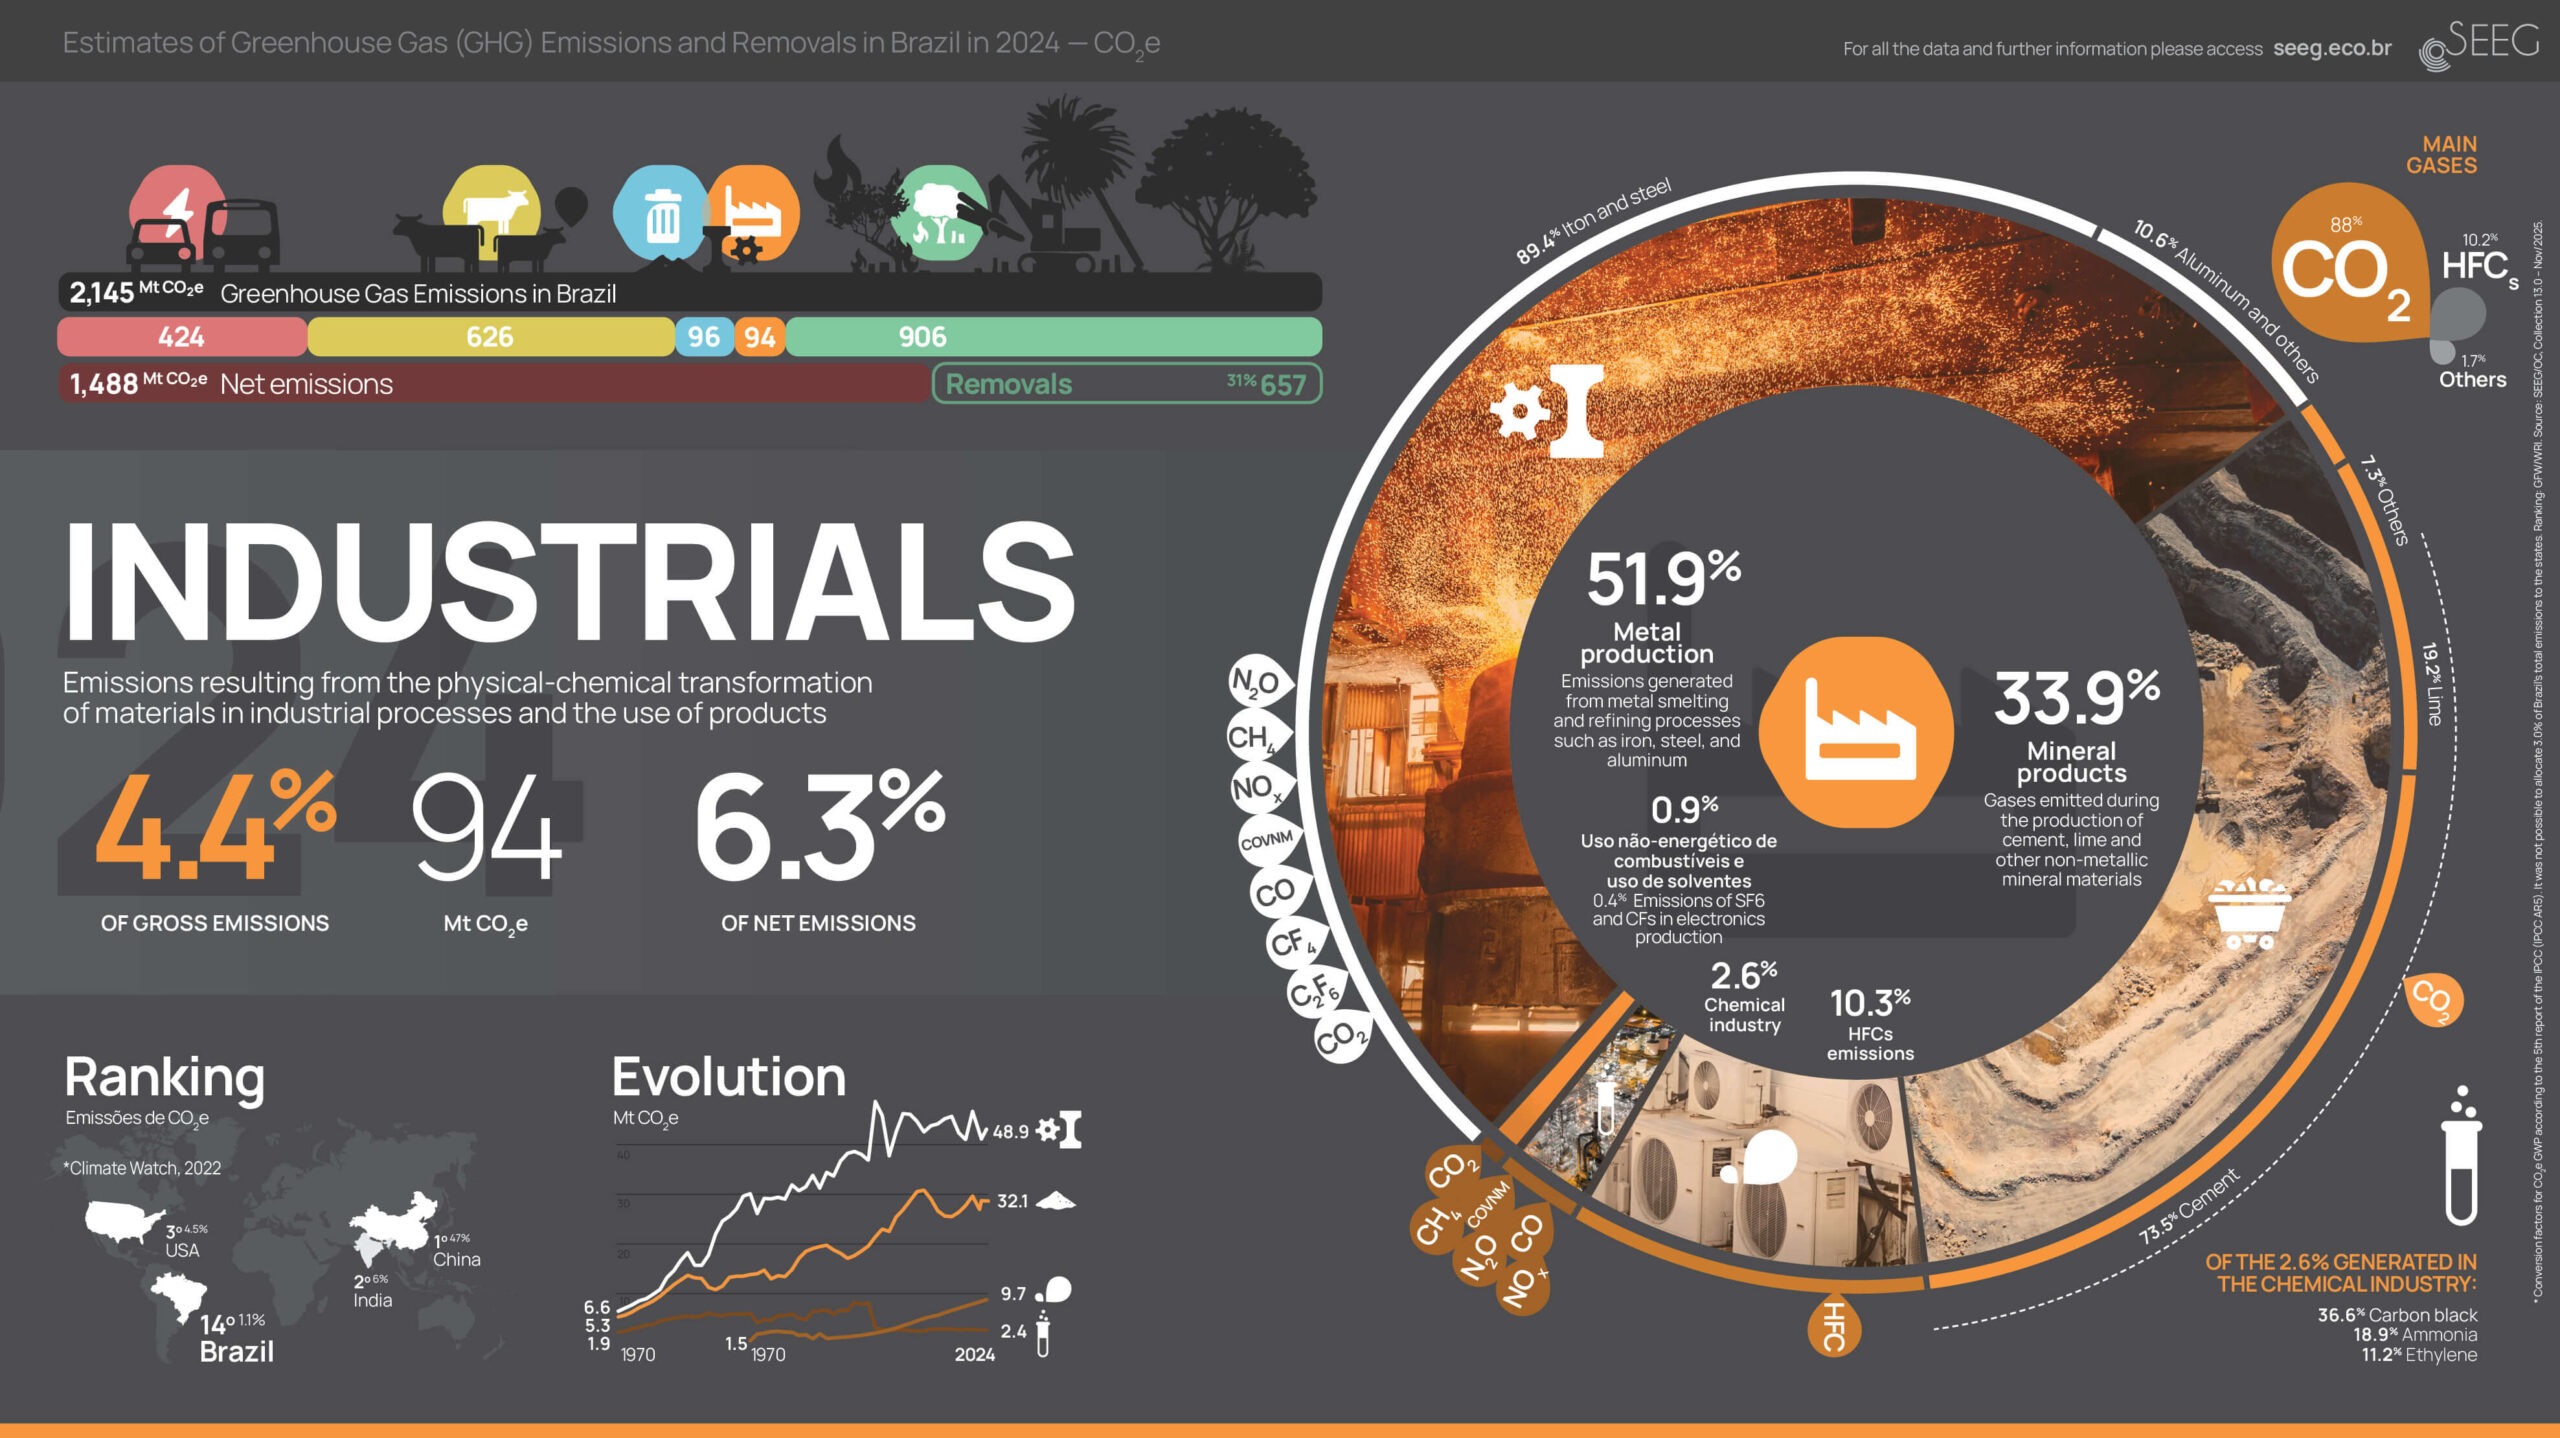
The following visualizations provide two general perspectives on national greenhouse gas emissions in the last year. One includes total emissions by sectors, as well as removals, gases, bunker emissions (international transport), and Brazilian regions. The other shows historical totals since 1990, emissions and removals at the state and sectoral levels. In the 5 sectoral infographics, we demonstrate the overall panorama of each sector as well as the detailed historical evolution, distribution in emitting sources, various gases, and country rankings. Click on the images to view in full screen and download.
OVERVIEW OF GREENHOUSE GAS EMISSIONS AND REMOVALS IN BRAZIL (CLICK ON IMAGES TO ENLARGE)
How to cite: “Source: SEEG – Greenhouse Gas Emissions and Removals Estimation System, Climate Observatory, accessed on [date] – seeg.eco.br”.